Data Visualization Through Principal Component Analysis
PCA finds a projection that captures the largest amount of variation in the data. The original data are projected onto a much smaller space, resulting in dimensionality reduction. We find the eigenvectors of the covariance matrix, and these eigenvectors define the new space.
PCA was performed on the dataset after removing the transient component of the data of the BRB dataset.
The figure above shows the principal components at load of 5Nm
The figure above shows the principal components at load of 10Nm
The figure above shows the principal components at load of 20Nm. It can be seen that the blue part (healthy data) moves towards the inside of the plot.
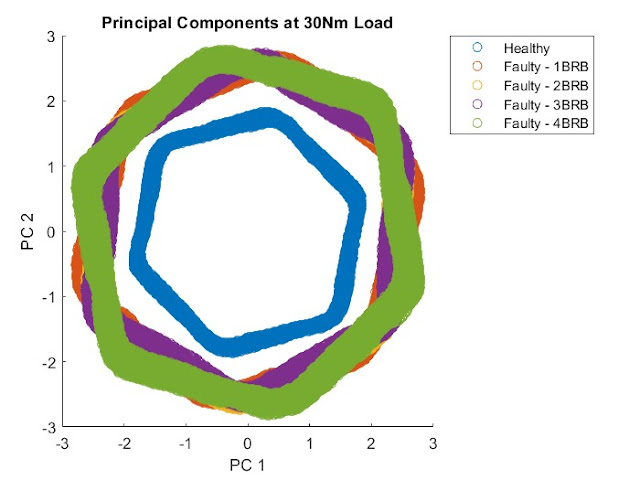
The figure above shows the principal components at load of 30Nm. The plots are rotating in an anticlockwise direction. The healthy data at the center remains unchanged.
The figure above shows the principal components at load of 40Nm. The same can be seen here as in the previous figure.


Comments
Post a Comment